Dynamic
When setting a tomographic experiment several parameters are adjusted by the instrument operator including X-ray energy, exposure time, frame rate, rotary stage speed, scanning mode (sequential or interlaced angles etc.). Here we include a series of datasets collected at different experimental conditions aiming to capture fast evolving samples in 3D.
Noisy Data
Sometimes data collection speed requirements, e. g. in evolving samples, impose very short exposure times generating noisy data. Here we include a dataset, Dorthe_F_002, in which the exposure time much shorter than the optimal value. The sample description and the experimental conditions are reported in tables below: and accessible for download under tomo_00031.
To load the data sets and perform a basic reconstruction using tomopy
tomopy recon --file-name tomo_00031.h5 --rotation-axis 484.5
tomo_ID |
00031 |
|---|---|
Image preview |
|
Downloads |
|
Instrument |
APS 13-BM-D |
Sample name |
Dorthe_F_002 |
Energy |
33.269 keV |
Monochromator |
double crystal Si (1,1,1) |
Scan Range |
180 degree |
Number of Projections |
900 |
White Fields |
20 before |
Dark Fields |
none |
Exposure Time |
0.006 s |
Frame Rate |
80 frames/s |
Total Collection Time |
11.25 s |
PixelSize |
3.18 µm |
Rotation axis location |
484.5 |
Lower Resolution
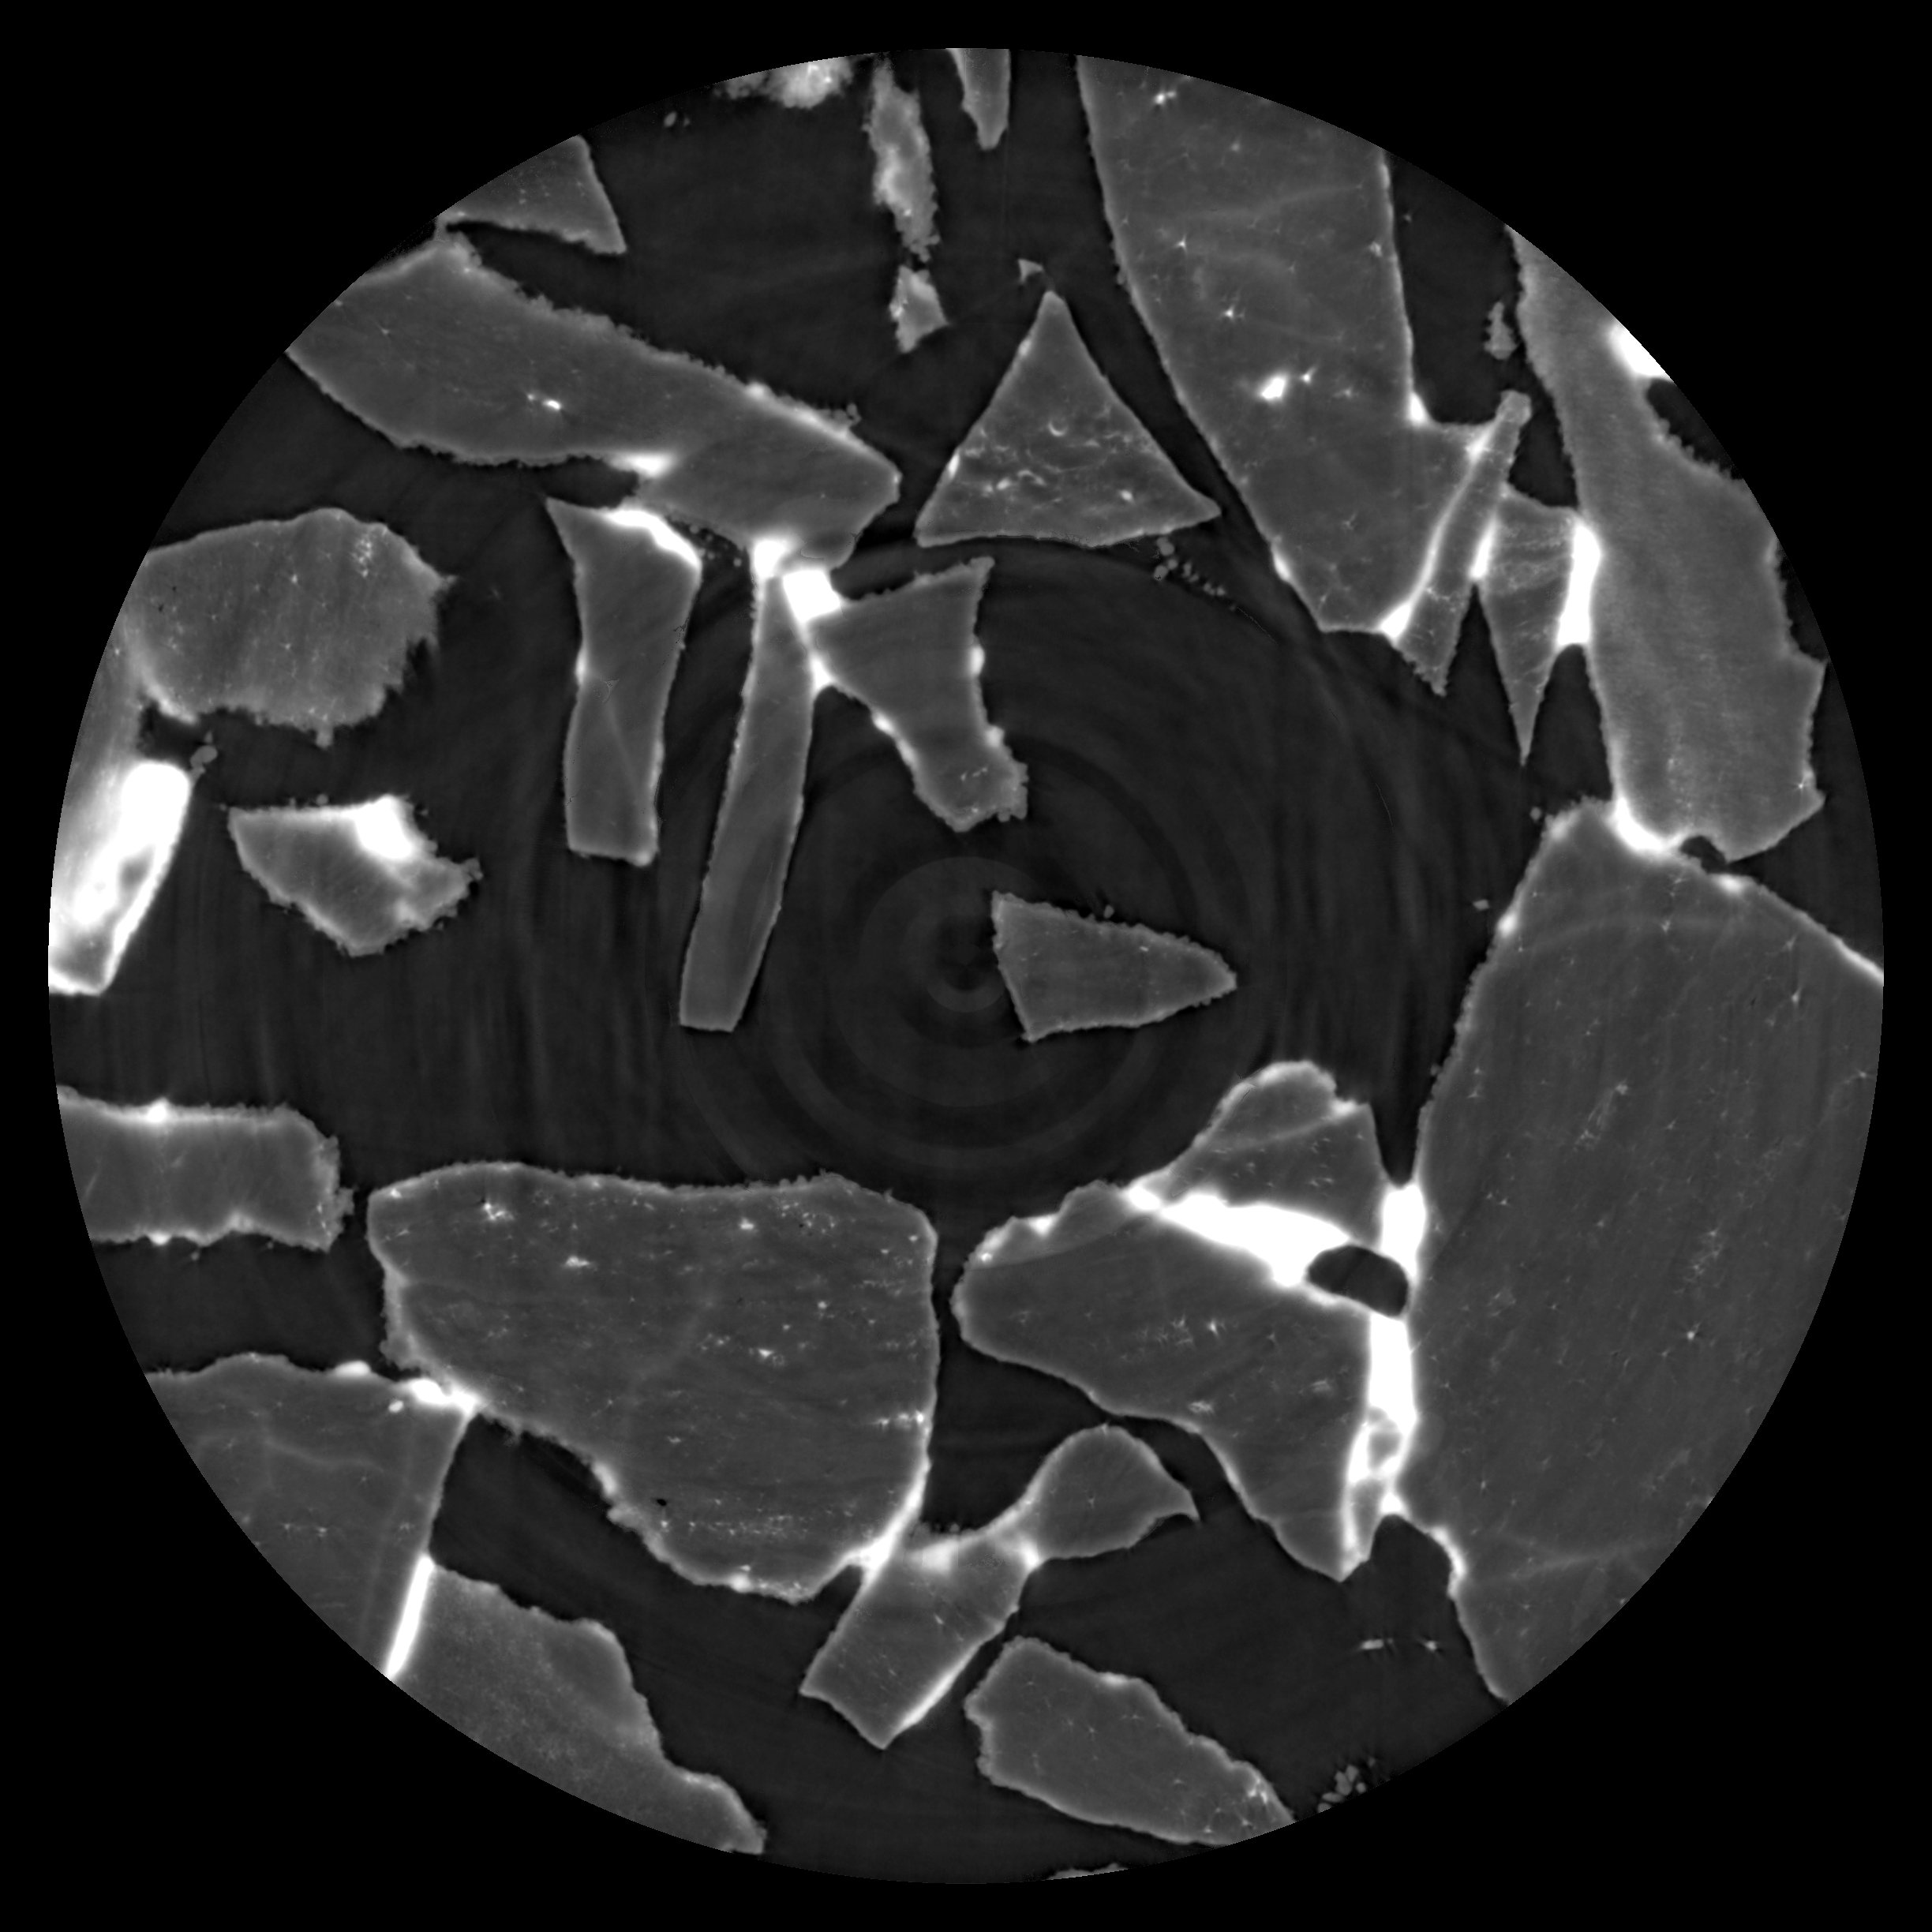
This study was optimized for temporal resolution and less for spatial resolution. The experiment was originally designed to follow the propagation of a Cs solution with time in a rock. The spatial resolution could be relaxed at the time of the experiment to provide sufficient time resolution.
In the second phase of the project, the focus moved however towards the smaller reactive inclusions and complementary techniques (x-ray microprobe and destructive chemical tomography with LA-ICP-MS) have been used to investigate the distribution of different elements and phases in selected regions, with sometimes higher spatial resolution than in the original tomographic dataset (see [B19], [B3]).
To load the data sets and perform a basic reconstruction using tomopy
tomopy recon --file-name tomo_00069.h5 --rotation-axis 515.50
tomo_ID |
00069 |
|---|---|
Image preview |
|
Downloads |
|
Instrument |
SLS TOMCAT |
Sample name |
SLS_03/Cskin1_36__B1 |
Energy |
36.085 keV |
Sample-to-detector distance |
4 mm |
Scan Range |
180 degree |
Number of Projections |
1001 |
White Fields |
20 (10 before - 10 after) |
Dark Fields |
5 |
PixelSize |
3.7 µm |
Rotation axis location |
515.500232028 |
Interlaced Scan
A technique adopted to capture fast evolving sample includes interlaced data collection. In this mode multiple series of continuous 0-180 deg datasets are collected with equally spaced sparce angles. After each 0-180 deg rotation the next data set is collected with angular sampling interlaced to the previous scan.
Below we report the sample description and the experimental conditions for an interlace dataset (tomo_00057) [B13] collected at the Elettra Syrmep beamline.
tomo_ID |
00057 |
|---|---|
Image preview |
|
Downloads |
|
Instrument |
Elettra Syrmep |
Sample name |
Bone MR |
Energy |
24 keV |
Filter |
1 mm Al |
Sample-to-detector Distance |
210 mm |
Scan Range |
180 degree |
Interlaced Data Collection |
20 projections x 36 (0-180 deg) iteration |
Total Projections |
720 |
White Fields |
20 |
Dark Fields |
20 |
Exposure Time |
0.8 s |

Foam data
In this study, we investigate the rheology of liquid foams by fast synchrotron X-ray tomographic microscopy [B38]. Foams are complex cellular systems which require artifact free tomographic reconstruction for a reliable quantification of their time-dependent properties such as deformation fields of bubbles. In our example we acquire X-ray projections of the liquid foam flowing through a constriction and being rotated around the tomographic axis. The experiment was performed at the TOMCAT beamline of the Swiss Light Source using the fast acquisition setup [B34].
To load the data sets and perform reconstruction use the tomopy_rectv.py python script.
Reconstruction by Gridrec
python tomopy_rectv.py dk_MCFG_1_p_s1_.h5 --type subset --nsino 0.75 --binning 2 --frame 95
Reconstruction by the method with suppressing motion artifacts [B51] requires module rectv that can be installed from https://github.com/math-vrn/rectv_gpu. In this case, the algorithm run with option –tv True
python tomopy_rectv.py dk_MCFG_1_p_s1_.h5 --type subset --nsino 0.75 --binning 2 --tv True --frame 95
tomo_ID |
00080 |
|---|---|
Image preview |
|
Downloads |
|
Instrument |
SLS TOMCAT |
Sample name |
dk_MCFG_1_p_s1 |
Energy |
16 keV |
Sample-to-detector Distance |
250 mm |
Scan Range |
180 degree |
Continuous Data Collection |
300 projections x 130 (0-180 deg) iteration |
Total Projections |
39000 |
White Fields |
512 |
Dark Fields |
512 |
Exposure Time |
0.7 ms |
Frame rate |
840 deg/s |
PixelSize |
3 µm |
Rotation axis location |
1008 |
Fuel cell data
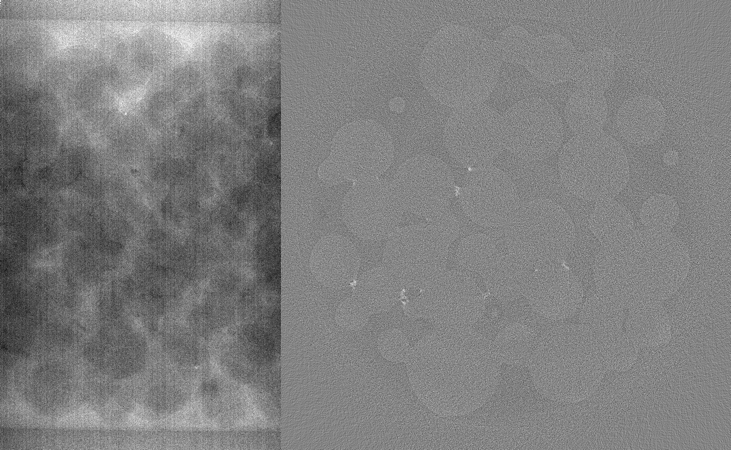
This data was first provided to TomoBank to be used as part of TomoChallenge, please see https://tomochallenge.github.io/ for more details and for information about how you can participate. Sub-second X-ray tomographic microscopy was exploited to investigate liquid water dynamics in a fuel cell during operation. During the experiment, the cell was rotated continuously around the tomographic axis and three tomographic datasets, each consisting of 60 consecutive scans, were acquired. Each of the three datasets (60 scans) was acquired within 6 seconds, the interval period between each dataset was approximately 7 seconds. The outer boundaries of the cell were slightly outside of the field-of-view, leading to interior tomography. The experiment was performed at the TOMCAT beamline of the Swiss Light Source using the fast acquisition setup coupled with high-numerical-aperture macroscope optics [B4].
At the start of the experiment the cell was completely dry. During operation, water generated on the surface of the catalyst layer (Pt based, bright area in image preview) started to propagate through the porous fiber layer (carbon based gas diffusion layer located between the four channels), emerging in the channels. A large water droplet can be clearly visually detected in the reconstructed channel region after the 115th time step (e.g. slice 364).
The image preview is an example of a fuel cell slice reconstructed by Gridrec from phase retrieved [B12] projections and cropped to the region of interest. The flow field (FF) consists of carbon based material, the gas diffusion layer (GDL) of carbon fiber and the catalyst coated membrane (CCM) of a polymer, coated with a Pt based catalyst. Image courtesy of Hong Xu (Paul Scherrer Institut).
To load the dataset and perform basic reconstruction use the the tomopy_rectv_fc.py
python script
python tomopy_rectv_fc.py fuelcell_i1.h5
tomo_ID |
00081 |
|---|---|
Image preview |
|
Downloads |
|
Instrument |
SLS TOMCAT |
Sample name |
fuelcell_i1, fuelcell_i2, fuelcell_i3 |
Energy |
Polychromatic radiation (filtered, mean ~ 30 keV) |
Sample-to-detector Distance |
30 mm |
Scan Range |
180 degree |
Continuous Data Collection |
301 projections x 60 (0-180 deg) iteration |
Total Projections |
18060 |
White Fields |
100 |
Dark Fields |
10 |
Exposure Time |
0.3 ms |
Frame Time |
0.33 ms |
PixelSize |
2.75 µm |
Rotation axis location |
702 |
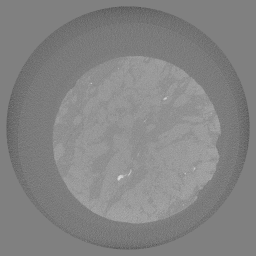
In addition to the dynamic datasets, a high-quality post operando scan of the fuel cell in dry state is provided. The scan parameters are specified in the table below.
To load the high-quality dataset and perform basic reconstruction use the tomopy_rectv_fc.py
python script:
python tomopy_rectv_fc.py fuelcell_dryHQ_i1.h5 --rotation-axis 702.00 --nproj 1001 --ntframes 1
tomo_ID |
00082 |
|---|---|
Image preview |
|
Downloads |
|
Instrument |
SLS TOMCAT |
Sample name |
fuelcell_dryHQ_i1 |
Energy |
Polychromatic radiation (filtered, mean ~ 30 keV) |
Sample-to-detector Distance |
30 mm |
Scan Range |
180 degree |
Total Projections |
1001 |
White Fields |
100 |
Dark Fields |
10 |
Exposure Time |
1 ms |
PixelSize |
2.75 µm |
Rotation axis location |
702 |

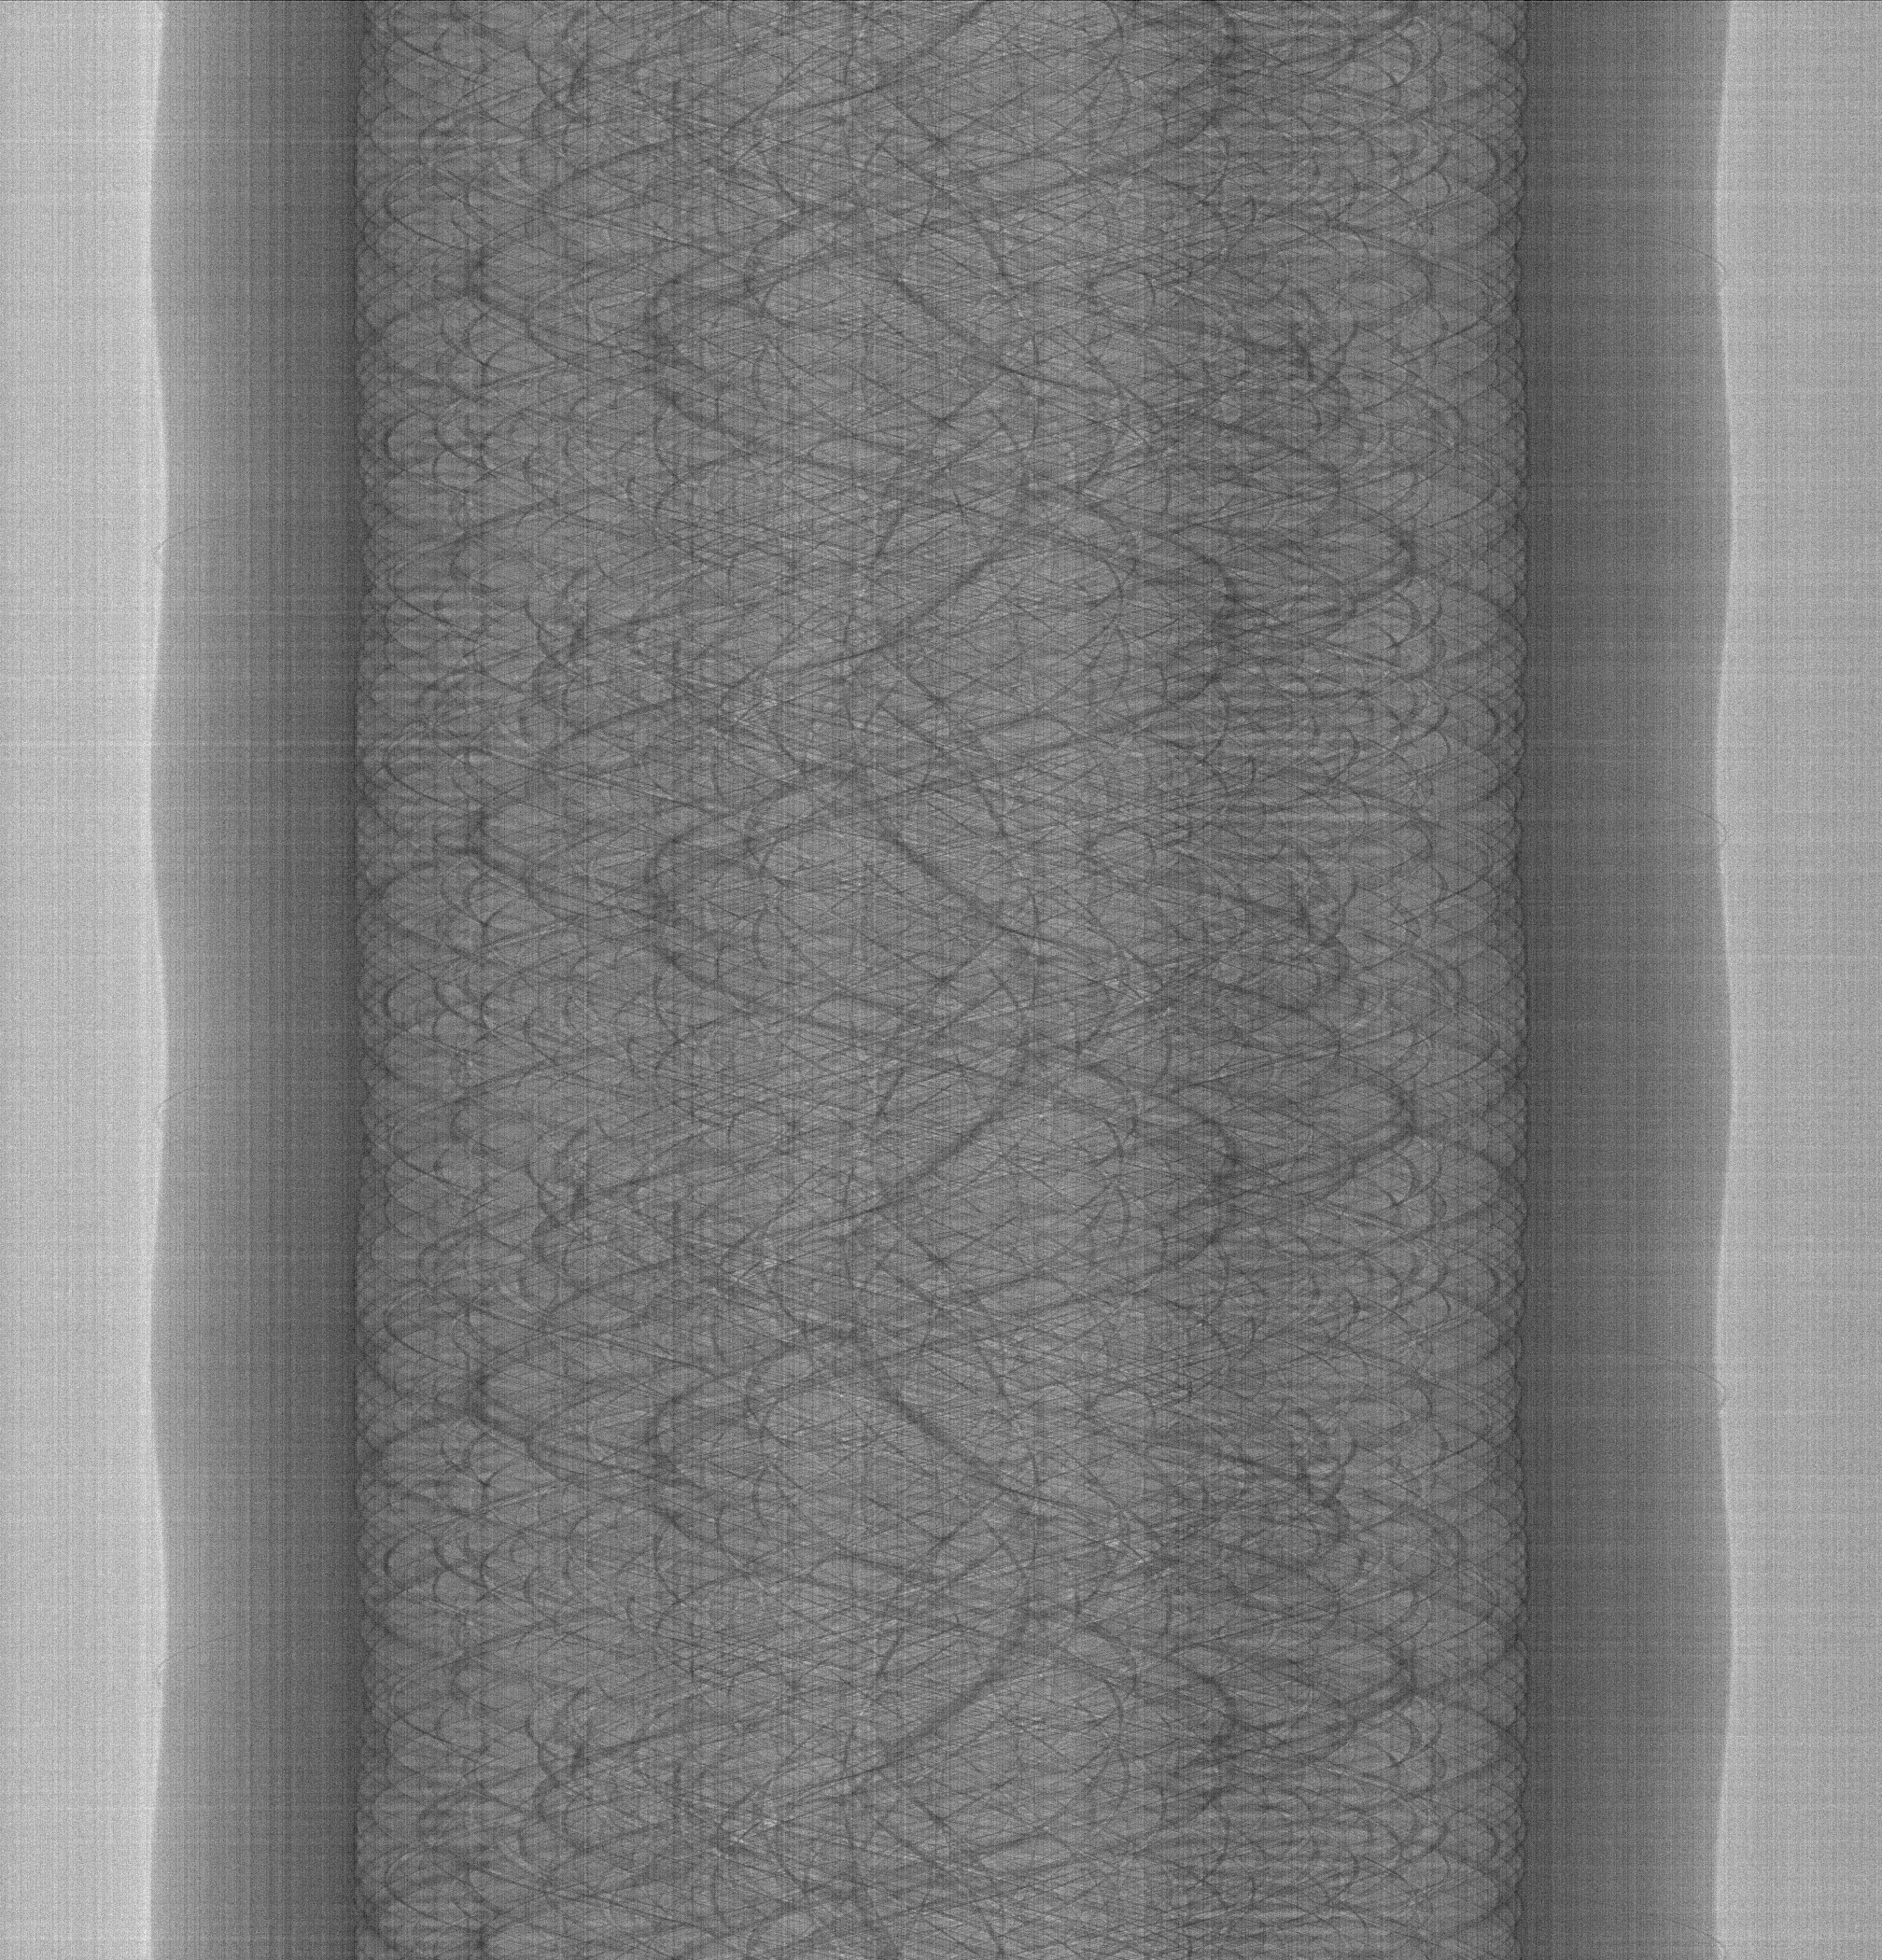
Methane Hydrate Formation
This dataset contains data from a dynamic in situ micro-computed tomography experiment of methane-hydrate formation in porous coal samples [B36].
Experimental study of gas-hydrate formation in coal samples is challenging because of the coal microporous structure and lower X-ray contrast. Synchrotron X-ray tomographic microscopy was applied to achieve sufficient contrast levels to separate all the materials of interest (gas, water, coal, and gas hydrate). The experiment was conducted at Sector 2-BM of the Advanced Photon Source.
The coal sample inside the environmental cell was rotated by 180 deg every 15 min and scanned to capture the evolution of methane-hydrate morphology. During the experiment, hydrate formation was accompanied by water movement driven by cryogenic suction, which occurred as sequences of rapid and short flows with longer equilibrium states in between.
The first image (tomo_00102) captures the sample’s lower section after establishing pressure-temperature (PT) conditions favorable for methane-hydrate growth/dissociation. Here, the system remains quasi-stationary with no subsecond flow processes. The second image (tomo_00103), taken 12 hours later, shows the middle-upper section of the sample, where intensive subsecond flow processes occurred during scanning due to cryogenic suction.
tomo_ID |
00102 |
|---|---|
Image preview |
|
Downloads |
|
Instrument |
APS 2-BM |
Sample name |
stable_coal5wtNaBr5p |
Energy |
20 keV |
Sample-to-detector Distance |
100 mm |
Scan Range |
180 degree |
Number of Projections |
1500 |
White Fields |
30 |
Dark Fields |
20 |
Exposure Time |
70 ms |
Frame rate |
1.7 deg/s |
PixelSize |
1.725 µm |
Rotation axis location |
1233 |
tomo_ID |
00103 |
|---|---|
Image preview |
|
Downloads |
|
Instrument |
APS 2-BM |
Sample name |
unstable_coal5wtNaBr5p |
Energy |
20 keV |
Sample-to-detector Distance |
100 mm |
Scan Range |
180 degree |
Number of Projections |
1500 |
White Fields |
30 |
Dark Fields |
20 |
Exposure Time |
70 ms |
Frame rate |
1.7 deg/s |
PixelSize |
1.725 µm |
Rotation axis location |
1238 |